When dealing with legacy, inherited, vendor, or custom bash shell scripts, especially those involving multiple functions and sourcing other child scripts, it’s important to track the flow of files being read and updated. This is particularly relevant if these scripts are invoked by systemd.
Challenge: Capturing the entire data flow in complex scripts can be laborious.
Solution: We’ve explored various methods, including the use of default file descriptors and redirection, as outlined in the bash manual and other resources. Among these, a notable feature is available for bash versions greater than 4.1, which significantly aids in debugging.
Bash Version Check: To utilize these debugging features, first confirm your bash version. You can do this using one of the following three methods:
echo "${BASH_VERSION}"

bash --version

Keyboard method in a shell:    Ctrl + x  then  Ctrl + v
Leveraging BASH Variables for Enhanced Script Debugging
Key Variables: In the realm of Bash scripting, two significant variables stand out for effective debugging:
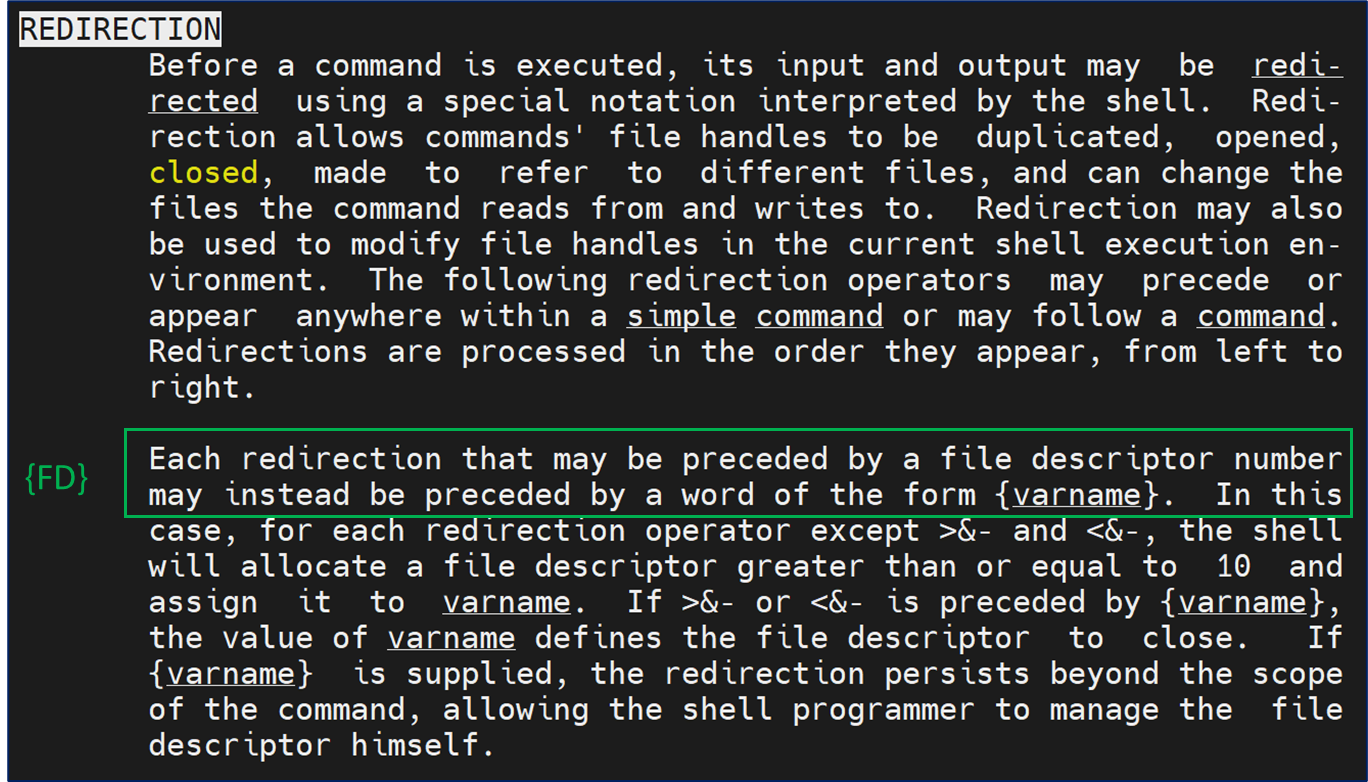
- {FD}: This variable plays a crucial role in handling file descriptors within your scripts.
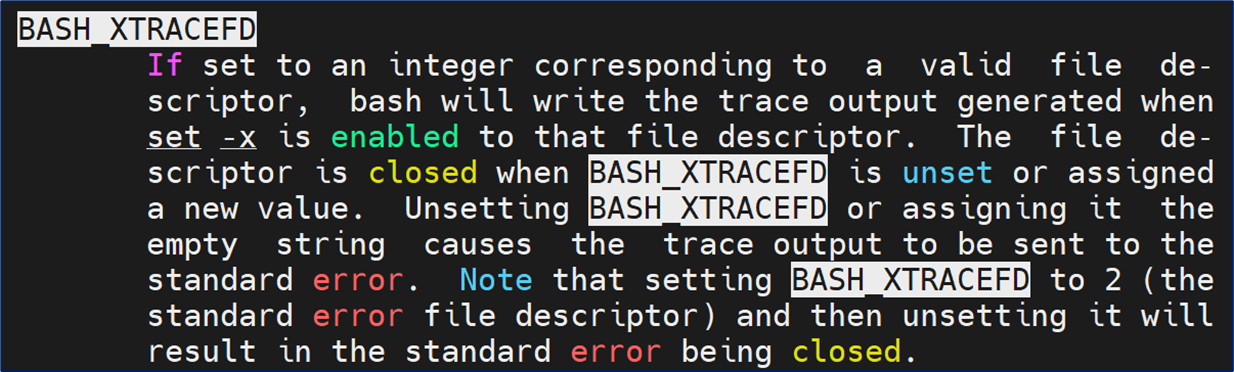
- {BASH_XTRACEFD}: Specifically designed for tracing purposes, it aids in redirecting the output of set -x.
Finding More Information: For a comprehensive understanding of these variables, refer to the Bash man page. You can find detailed explanations and usage guidelines under the REDIRECTION section, second paragraph. This section provides insights into how these variables interact with the file system and how they can be optimally used in your scripts.
Optimizing Debugging in Bash Scripts Using Custom File Descriptors
Defining the {FD} Variable:
- Purpose:
{FD}is a user defined string to hold the number of a free file descriptor. This approach avoids reliance on the default file descriptors 1 (standard output) and 2 (standard error). - Advantage: By not using the defaults, we ensure that the normal functions of the scripts, especially those dependent on standard output/error, are not inadvertently altered.
- Relation to System Limits: The value of
{FD}correlates with the system’s limit on open file descriptors, which can be checked usingulimit -n.
Integrating {BASH_XTRACEFD}:
- Function: This pre-defined variable links the integer provided by
{FD}with theset -xtracing process in Bash. - Benefit: This linkage allows for more effective and targeted debugging.
Combining Variables for Enhanced Debugging:
- By tying
{FD},{BASH_XTRACEFD}, and the internal tracing process together, we create a robust method for debugging and tracing in Bash scripts.
Allocate a File Descriptor:
- Run the following line [ exec {FD}>/tmp/file ; echo ${FD} ] multiple times to allocate a file descriptor integer.
- If not within a Bash shell script, remember to close the open file descriptor afterward.
exec {FD}>/tmp/file ; echo ${FD}

exec {FD}>/tmp/file ; echo ${FD} ; exec {FD}>&- ; echo ${FD}
Monitoring File Descriptors:
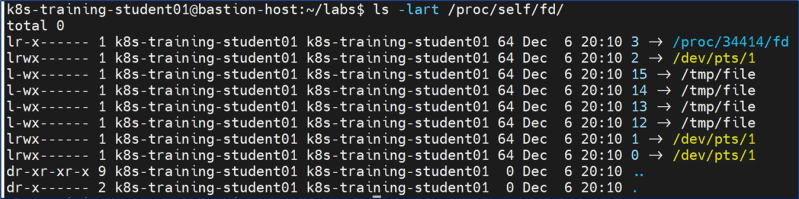
- When observing the file descriptors in a Bash environment, especially through the path
/proc/self/fd, certain descriptors are typically reserved.
Reserved Descriptors:
- 0: Standard Input (stdin)
- 1: Standard Output (stdout)
- 2: Standard Error (stderr)
- 3: In this specific context, descriptor 3 is observed as the PID for the
lscommand that was recently executed.
Key Takeaway:
- This insight underscores the importance of understanding how different file descriptors are utilized and reserved within the Bash environment, particularly when developing or debugging scripts. By knowing which descriptors are reserved or in use, you can avoid conflicts or unintended behaviors in your script execution.
ls -lart /proc/self/fd/
Advanced Data Flow Tracking in Bash Scripts with Enhanced Debugging Techniques
Combining Debugging Processes:
- By integrating the previously discussed file descriptor management and tracing methods with the addition of a date-time stamp in milliseconds, we create a powerful tool for capturing the entire data flow in Bash scripts.
Incorporating Date-Time Stamps:
- This involves appending a precise timestamp (in milliseconds) along with the name of the Bash shell script file in the debug output. This enhancement allows for more detailed and time-specific tracking of script execution.
Utility Across Parent Processes:
- Such an approach is especially beneficial for scripts that are commonly sourced in different contexts, like those used in start and stop processes. It ensures comprehensive data capture, irrespective of the parent process that initiated the script.
Ownership Management with chown:
- To further refine the process, a
chowncommand has been added. This is particularly useful when the Bash shell scripts are not owned by the executing user ID. - The
chownprocess is configured to change the ownership of these scripts from ‘root’ to a specified non-root user ID. This step is crucial for scenarios where script execution under a non-root user is necessary for security or organizational policies.
Summary:
- By synthesizing file descriptor management, tracing with
set -x, timestamping, and ownership adjustment, we establish a comprehensive debugging and tracking mechanism. This method offers a detailed insight into script execution and is invaluable for complex environments where multiple scripts interact and where permission and ownership nuances are critical.
tz=`/bin/date --utc +%Y%m%d%H%M%S3%N.0Z`

SCRIPT_FILENAME=$(basename $(readlink -f $0))

# Use a free FD (file descriptor) to capture the debug stream caused by "set -x":

exec {FD}>/tmp/${tz}-${SCRIPT_FILENAME}-debug.log

BASH_XTRACEFD=${FD}

chown ec2-user:ec2-user /tmp/${tz}-*-debug.log

# turn on the debug stream:

set -x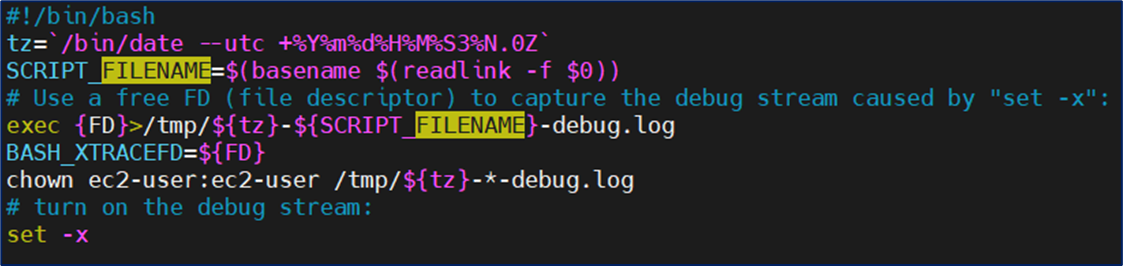
Now, execute the script or allow systemd processes to run.
Tracking Script Execution with Timestamped Output Files
Output File Generation:
- The debugging process described earlier will generate multiple output files. These files are recommended to be stored in the
/tmpdirectory.
Naming Convention of Output Files:
- Each output file follows a specific naming convention that incorporates the timestamp (in milliseconds) and the script’s name. This format aids in accurately tracking the execution flow and timing of the scripts.
Sorting and Reviewing Output Files:
- Using
ls -al:- To review these output files effectively, employ the command
ls -al. This command lists files with detailed information, including their creation or modification times.
- To review these output files effectively, employ the command
- Sorting by Timestamp:
- Sort the output files by their date-stamp names. This sorting ensures that the files are displayed in the correct chronological order, reflecting the sequence of script execution.
Practical Application:
- This method of tracking via timestamped output files is particularly useful in complex environments where understanding the sequence and timing of script executions is crucial. By sorting the files, administrators and developers can gain insights into the script’s behavior and interactions over time.
ls -al /tmp/*.log


start_process

-rw-r--r-- 1 ec2-user ec2-user  7721 Dec  6 11:35 /tmp/202312061635393500776926.0Z-start-jboss_start_pre.sh-debug.log

-rw-r--r-- 1 ec2-user ec2-user 76931 Dec  6 11:35 /tmp/202312061635393557011038.0Z-start-jboss_start_pre.sh-debug.log

-rw-r--r-- 1 ec2-user ec2-user 12226 Dec  6 11:35 /tmp/202312061635403268056910.0Z-increase_jboss_access.sh-debug.log

-rw-r--r-- 1 ec2-user ec2-user  8483 Dec  6 11:35 /tmp/202312061635403367517901.0Z-set_jboss_params.sh-debug.log

-rw-r--r-- 1 ec2-user ec2-user 83961 Dec  6 11:35 /tmp/202312061635403585892921.0Z-start-jboss_start_pre.sh-debug.log

-rw-r--r-- 1 ec2-user ec2-user 53134 Dec  6 11:35 /tmp/202312061635423009460436.0Z-start-jboss_start_pre.sh-debug.log

-rw-r--r-- 1 ec2-user ec2-user 19460 Dec  6 11:35 /tmp/202312061635423472267227.0Z-reset_jboss_deployment_status-debug.log

-rw-r--r-- 1 ec2-user ec2-user  7763 Dec  6 11:35 /tmp/202312061635423606880351.0Z-generate_jboss_tls_certificate-debug.log

-rw-r--r-- 1 ec2-user ec2-user  9986 Dec  6 11:35 /tmp/202312061635423663787276.0Z-generate_jboss_tls_certificate-debug.log

-rw-r--r-- 1 ec2-user ec2-user 12624 Dec  6 11:36 /tmp/202312061635423756198600.0Z-start-jboss_start_post.sh-debug.log


stop_process

-rw-r--r-- 1 ec2-user ec2-user  7513 Dec  6 11:36 /tmp/202312061636233089744060.0Z-start-jboss_stop.sh-debug.log

-rw-r--r-- 1 ec2-user ec2-user 11188 Dec  6 11:36 /tmp/202312061636233147040616.0Z-set-jboss-config.sh-debug.log

-rw-r--r-- 1 ec2-user ec2-user  8277 Dec  6 11:36 /tmp/202312061636233223278052.0Z-set-support-config.sh-debug.log
🌟 Dive into Debugging: Unraveling the Data with Grep and File Exploration 🕵️♂️
Exploring the Output Files:
- Now that you have your timestamped output files neatly organized in the
/tmpdirectory, it’s time to delve into the heart of debugging.
Using Grep for Efficient Analysis:
- The Power of
grep: Harness the capabilities ofgrepto sift through these files efficiently.grepis a powerful tool for searching text and can help you quickly locate the specific information you’re interested in within the files. - Isolating Relevant Data: Whether you’re looking for error messages, specific variable values, or particular function calls,
grepcan help you zero in on the exact lines you need.
Opening and Reviewing Files:
- Manual Inspection: For a more detailed analysis, open these files in your preferred text editor. This allows you to review the contents in detail and understand the broader context of the debug information.
- Sequential Understanding: Remember, each file’s name contains a timestamp, helping you piece together the sequence of events in your script’s execution.
Enjoy the Process:
- This is where the true fun begins – piecing together the puzzle. Enjoy the satisfaction of unraveling the complexities of your Bash scripts, gaining insights, and resolving issues more effectively than ever before!
Note: The picture below is provided to encourage and guide users in the final phase of their debugging journey, combining technical instructions with a touch of motivation.

Remember to disable this debug feature, otherwise you may fill up disk space on your server if these same scripts or functions are called periodically.